


In order to assess the performance of existing wind farms, specifically whether a wind farm is achieving its intended energy yield, Pondera has developed a method for preparing what is commonly known in the market as a Post-Construction Assessment.
By using this method, Pondera is able to analyse SCADA data from the wind farm (an electronic report of measurement and status values for each wind turbine), and then calculate what the ideal and theoretical maximum production could have been. Subsequently, a forecast of the expected future production is made. This is done partly based on long-term wind data sets (such as ERA5) that serve as a reference to translate annual wind fluctuations into long-term average wind speeds. In addition, possible changes in the environment and characteristics of the wind farm itself are also taken into account. The Post-Construction Assessment method also offers the possibility to identify deviations in the power curve.
The actual realised energy output is then compared with the calculations performed prior to the construction of the wind farm and with the Post-Construction Assessment results. This gives the customer early insight into possible shortcomings in the performance of the wind farm, with specific indications of what this could be attributed to. As an example: in one of the wind farms studied, a deviation in the power curve was found that led to a yield reduction of more than 5% on an annual basis compared to the expected yield. Thanks to the assessment carried out, this has now been identified and the owner of the wind farm can enter into a discussion with the wind turbine manufacturer.
A long-term annual energy production (AEP) can be calculated based on the SCADA data from production months that are considered normal. That calculation can be plotted against a local grid point of a long-term wind dataset (such as ERA5), out of which follows a correlation and regression analysis resulting in a figure as shown below:
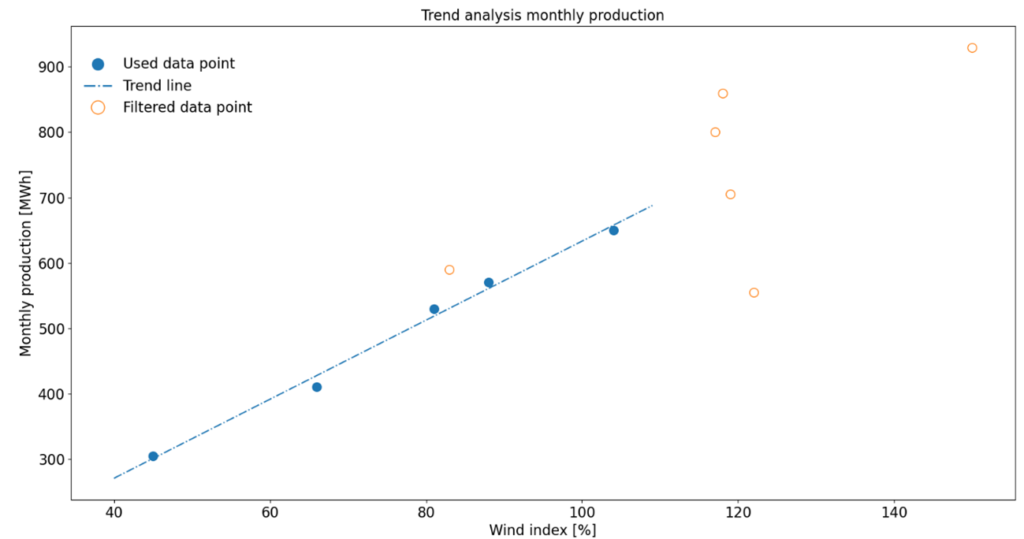
Using the ‘good’ production month points that have been included (the blue dots), a trend line is plotted that can be translated into average monthly production for the respective wind turbine (at 100% point = in this case approximately 630 MWh/month).
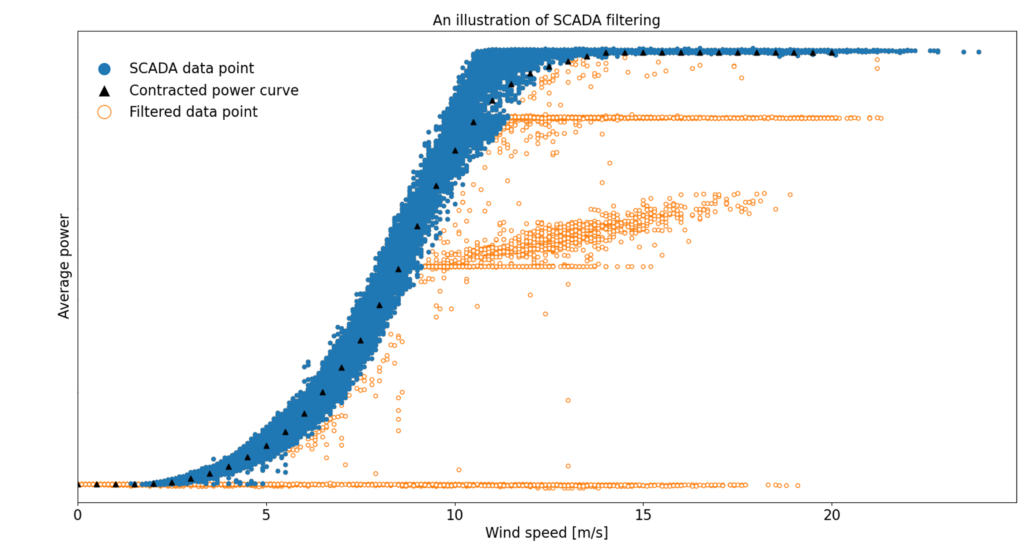
The figure below shows a SCADA 10-min scatterplot of a wind turbine in the operational phase.
By visualising this data, the behaviour of a wind turbine can be observed and certain undesirable trends can be identified in relation to the contracted power curve. All orange dots are marked as undesirable.
The developed Post-Construction Assessment method can be applied for both onshore and offshore wind farms. This enables a wind farm owner to increase insight into the performance and provides more certainty about the expected energy yields in the coming years. With this method, Pondera contributes to optimising the performance of your wind farm.


